In the lead up to the recent Australian federal election, a common talking point, once again, was the Cost of Living Crisis. Each of the parties pointed their finger at the other and laid blame for poor policy choices increasing costs of living, with housing and energy taking the brunt of blame. Outside of the election cycle, the same sentiment seems to arise ever more often; that life is hard, people are strained for time and money and continuously exhausted. This is in a time of the greatest material prosperity ever experienced. Where productivity gains courtesy of science and technology means that a mere 1% of the population in OECD countries is employed in providing the primary needs of the population [OECD].
So what is going on and how did we get here? How much of the pressure that is now so widespread is a result of our personal choices, and what can we do about it? There seems to be an underlying assumption, particularly in my home country of Australia, that the baby boomers got it easy and their choices and actions have made life for today’s young people far harder. One the other hand, we have had our politicians and senior business leaders, all Boomers themselves, point their fingers at young people and tell them that if they just worked harder and ate fewer cafe breakfasts they would have no problem getting by.
While blaming others may be a natural instinct to protect one’s own ego, it is rarely constructive and usually obfuscates any personal accountability for the situation. So to escape the blame cycle and just lay out the numbers I have spent some time digging. For Australians I found this great article from the Beaureau of Statistics comparing Boomer, X and Millienial generations. But even in the 1990s when boomers were buying houses, many of the same sentiments were being expressed. That it was difficult to get ahead, that people needed to be working ever harder to make ends meet. So I went back further. While it was difficult to be sure of the reliability of some of the figures, I pulled together what I could to provide at least an indication from two distinctly different decades; the 1960s and the 2020s. For this I focussed on data from the United States, as it is broadly accessible, but the trends are more or less similar across Australia and the UK, with some notable differences as explored below.
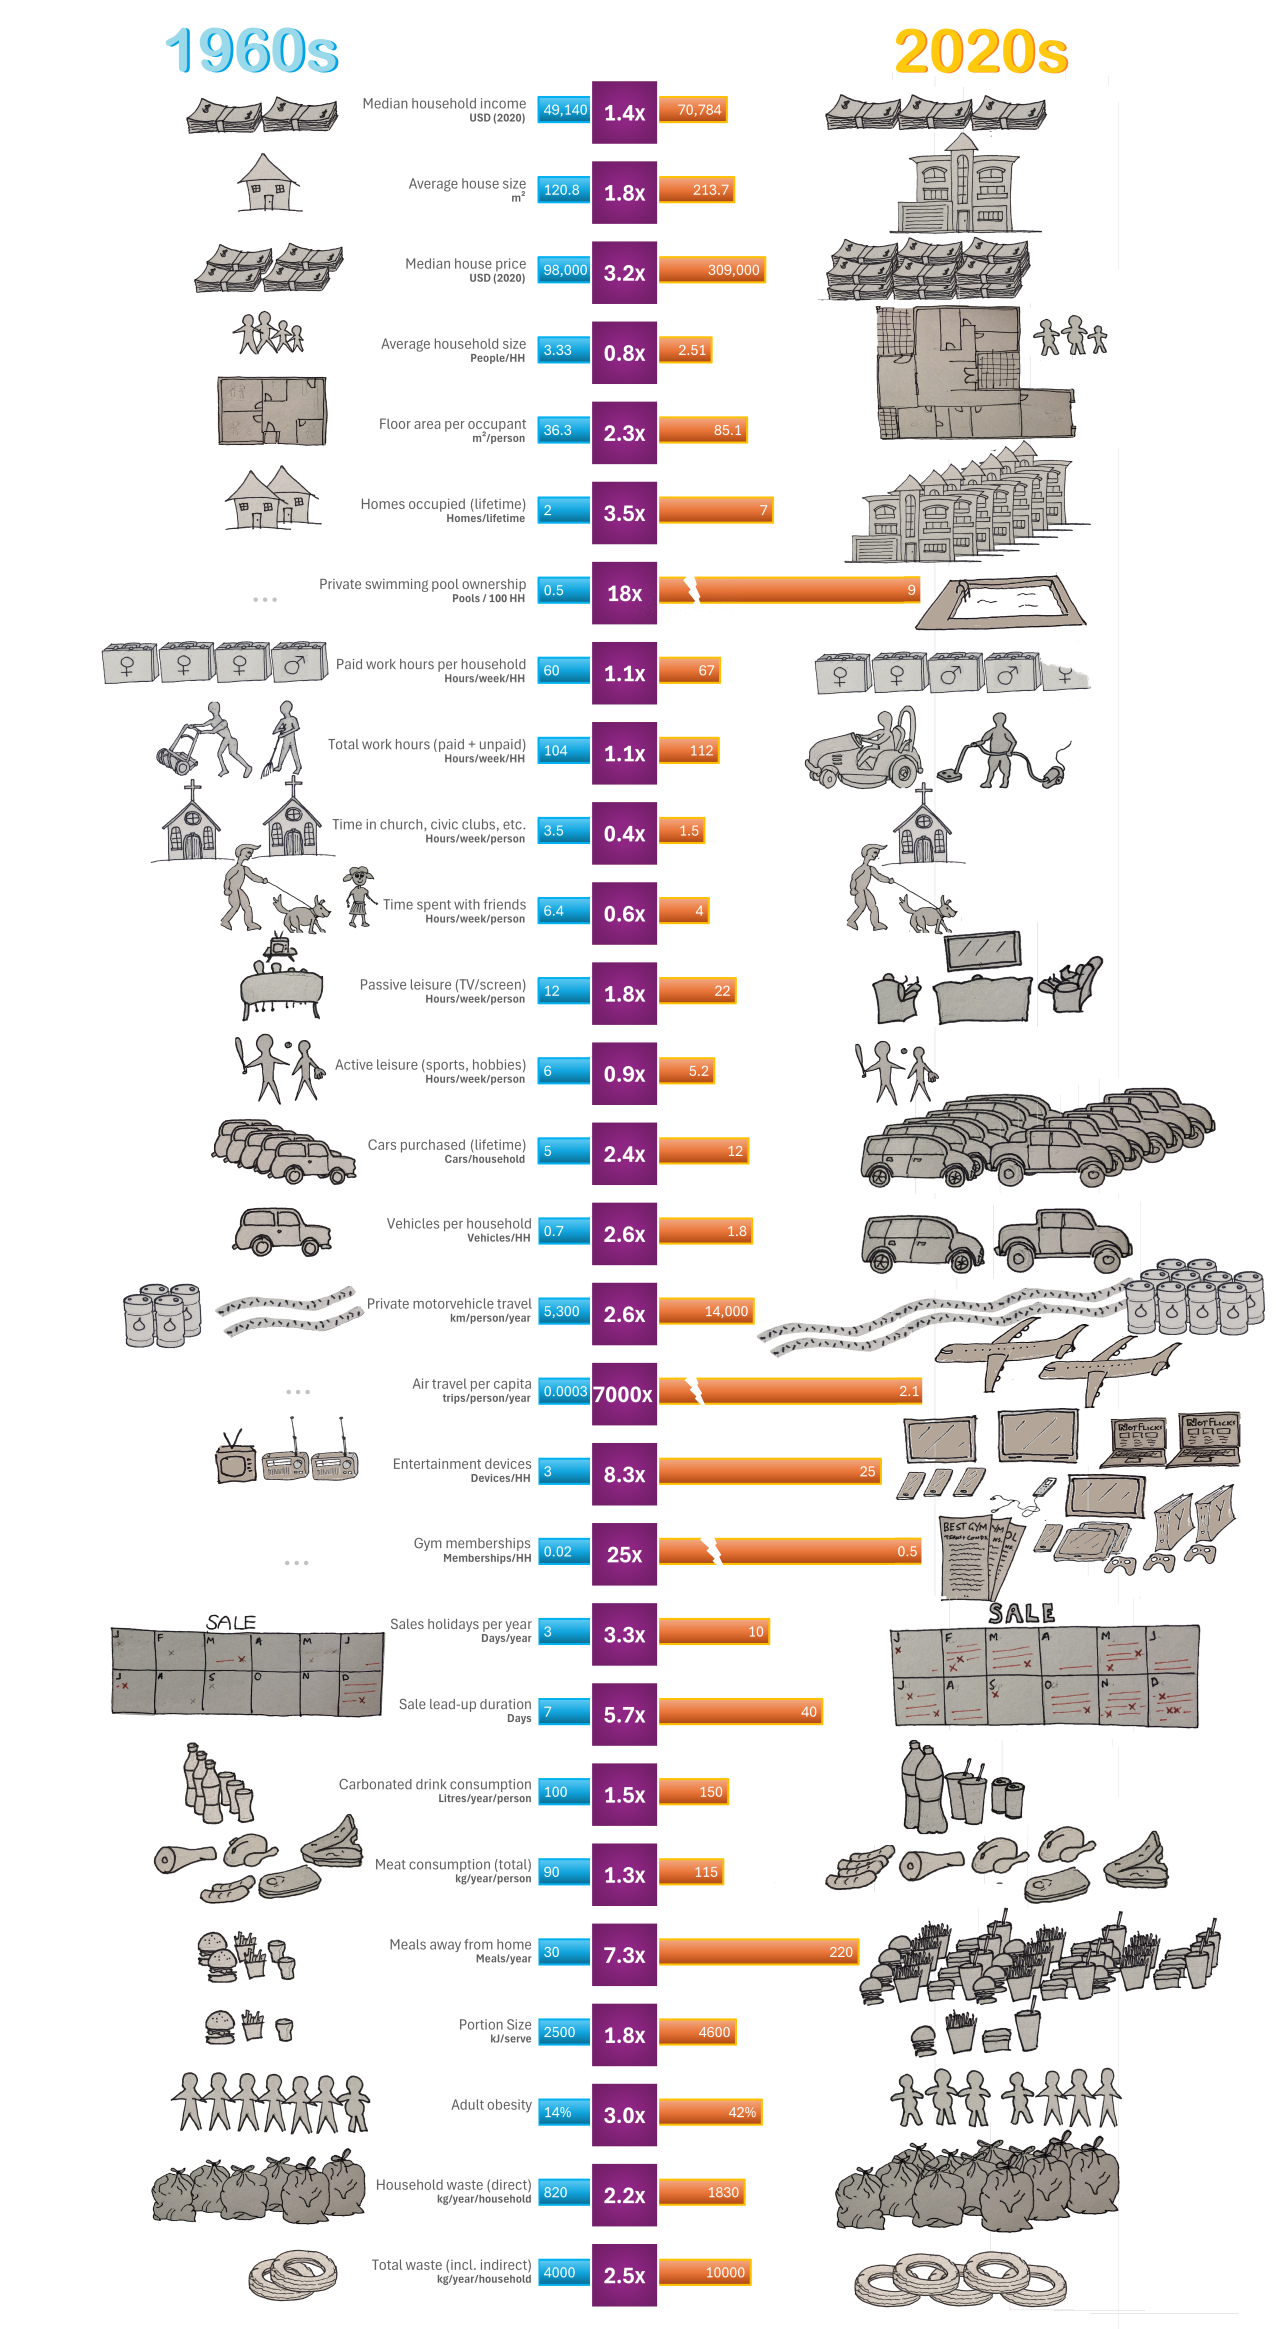
As you can see life for a middle-class American family was very different in 1960, not just in terms of technology, but in everyday expectations. Over 60 years, incomes rose, and with that extra purchasing power lifestyles have been supersized. Houses are more than twice the size and packed with far more stuff. People own more than twice as many cars and turn them over frequently, eat out seven times as much, and enjoy conveniences that were rare back in the day such as home and vehicle air conditioning, automatic dishwashers, microwaves and on demand entertainment. By many metrics, the middle-class Westerner in 2020 is materially richer than in 1960, yet feel so short on time and money. A huger part of this is inflation of aspirations as explored in The Progress Paradox.
The Cost-of-Living “Crisis” and Lifestyle Inflation
Listening to our grandparents, you’ll often hear “Back in my day, a family could live on one income and still buy a house!” and there’s truth to that. Housing has become less affordable relative to income. In 1960, the median house cost only about 2.1 times the median annual income. By 2020, the median house was around 4.3 times annual income [Census]. In other words, home prices outran inflation and income growth, – rising over 200% in real terms since 1960, whereas incomes rose only about 40%. Little wonder young families today feel stretched when buying their first home.
Yet, it’s not just housing prices that changed, our expectations changed too. The average new house in 2020 isn’t just more expensive because of market forces, although that is a huge factor to be reserved for another discussion; it’s also literally a lot bigger and decked out with amenities. In 1960, a middle-class family might have managed in a cozy 3-bedroom, 1-bath home. Today’s new homes at almost twice the size often boast 4+ bedrooms, multiple bathrooms, air conditioning, an enclosed garage, plus bonus rooms such as gyms and media rooms. We also expect a lot more privacy and personal space. The number of people per household has shrunk, so with the larger houses, the area per person has skyrocketed with 2.3 times more space per person! Essentially, we’re now heating, cooling, and maintaining much larger dwellings for fewer people. That’s a voluntary form of lifestyle inflation that directly drives up the cost of living with higher mortgage or rent, bigger energy bills, more furniture and more maintenance.
Transportation shows a similar pattern. In 1960, many families got by with a single car, or none at all with over 20% of households without a car at all. Today, 91% of U.S. households have a vehicle, and a majority have two or more. And these aren’t cheap basic models either with the average new car costing around $35,000, versus the inflation-adjusted $28,000 one might’ve paid for a typical new car in 1960. We’ve essentially traded the no-frills 5 seat sedan of the ’60s with it’s crank windows, natural ventilation, AM radio only to 7 seat SUVs and light trucks (utes for us Aussies) with touchscreens, driver-assist tech, climate control, heated seats and electric everything. While fuel efficiency has made substantial improvements, this has been more than offset by the rapid turn-over of vehicles and greater driving distances. While safety improvements over the past 60 years are to be celebrated, we could all drive 10-year-old Corollas and get from A to B much more cheaply, but we feel compelled to have the new and shiny with all the features, or feel we deserve it after working so hard.
Long distance transport stands out as an even starker contrast, with overseas or long distance flights going from being a considerable luxury in the 1960s to a right of passage for modern young people with 7000 times more flights per person. While the cost of flying has reduced substantially, this sort of travel still accounts for a cost of living that was all but non-existent in the past. And we can’t go past a discussion on flying without mentioning the massive impact is has on our environment, being the single largest contributor to global warming from the action of individuals [1, 2, 3]. Following current trends the contributions from air transport alone will make keeping to the Paris targets near on impossible.
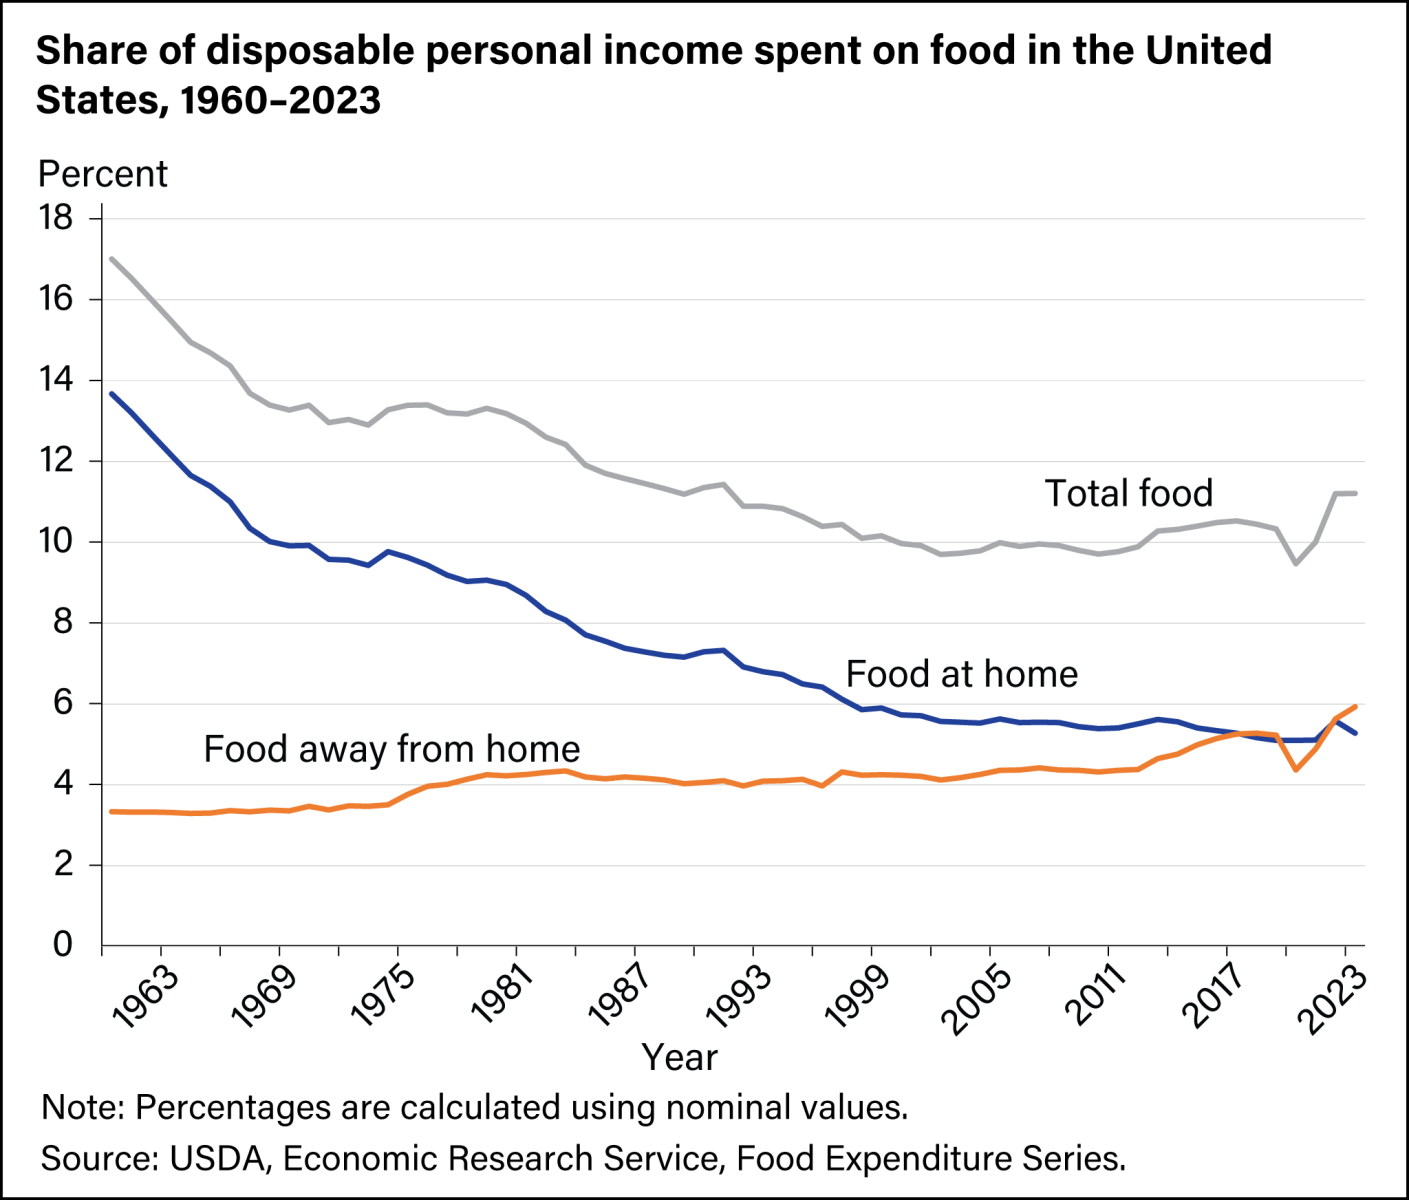
Food and entertainment are other areas where our spending has shifted by choice. Groceries actually take a smaller slice of the income pie now than in 1960 at only about 10% of income vs. ~17% back then. Thanks to higher agricultural productivity, global supply chains and increasingly externalised environmental costs, basic food is relatively cheaper. Yet total spending on food does not reflect this trend. While eating away from home has become cheaper, as a society we now eat out 7 times more than in the 60s, often out of a perceived need, thanks to our busy lifestyles [USDA]. Over the last few years spending on food prepared away from home has taken off even further with the near ubiquity of home delivery services.
Even education and healthcare, two sectors often cited as “crises” for costs, have a lifestyle component. It’s true US college tuition soared astronomically with a year at a public university that cost perhaps $4900 in 1960 (inflation adjusted) now runs closer to $15,000 [bestcolleges]. But part of that is because a college education became a more common life choice and often an expectation for the middle class, whereas in 1960 many Americans went straight into trades or jobs without a degree. We collectively decided that sending everyone to tertiary education (and often an expensive residential college far from home) is something we value and are willing to pay for, even if it strains us financially or via student loans.
Similarly, healthcare costs are up, but we also demand way more and better healthcare now – preventative screenings, pricey diagnostics, brand-name drugs, mental health services, etc., not to mention elective procedures that improve quality of life. Back in 1960, health spending was only 5% of U.S. GDP; by 2020 it swelled to ~17% [kff.org]. That’s partly an aging population, but also our expectation to use medicine for everything, from fertility to cosmetic fixes to extending life for decades.
More Stuff, More Stress?
All this isn’t to say there aren’t real economic pressures on the modern middle class. Housing is hard to afford in many cities and smaller or older homes can be hard to find, medical bills are scary (thankfully less so in OECD countries outside the US), and wage growth for some workers has lagged behind. But it’s important to recognize how much of our perceived “cost of living” challenge is tied to voluntary consumption choices. Sociologists call it the “aspirational gap” or “hedonic treadmill”. Our lifestyles inflate as our income grows, and often even faster, due to social pressures and rising standards of what’s considered “normal.” In 1960, a family of four in a 1-bath house with one car and no air-conditioning didn’t feel especially deprived. That was standard middle-class life.
Not to say they were satisfied with their circumstances – we got to where we are today somehow, didn’t we? But today, people living in that situation would be looked on with pity. Our baseline for comfort has shifted upward dramatically, and in spite of reports to the contrary, widespread surveys indicate this has led to a general increase in self-reported happiness, yet there is as yet few signs of people ever being satisfied with their current conditions. There is a powerful human instinct to improve our circumstances and seek comfort and novelty.
This lifestyle inflation however feeds the scarcity mindset. Something of benefit to the economy, but not to society. As this drive to stay ahead is keeping people working harder and longer than they really need to. While Americans now work about 250 hours less per year on average than in 1960 according to official statistics, and enjoy roughly 7 more hours of leisure per week. Yet many report feeling more rushed and stressed with anxiety and depression rates are at all time highs. How is that possible?
One theory is that we’ve traded some of those saved work hours for other obligations and hyper-consumption. We shuttle kids to more activities, spend evenings managing our growing inventory of gadgets and errands, or even do gig work on the side to afford extras. Plus, with smartphones and laptops, work regularly intrudes on leisure. In the 1960s, when you left the office or clocked out of the factory, you really left work. Now, many of us are checking emails at night or taking work calls while holidaying. So effectively, some of the time that could be true leisure is devoured by our always-on lifestyle.
There’s also a mental health toll in the form of social comparison. Traditional advertising aside, we constantly see the highlight reels of others’ lives – the remodeled kitchens, exotic destinations, well-dressed kids, etc. This amps up the pressure to keep up materially, whether we realise this or not. Back in 1960, you mostly compared yourself to your immediate neighbors or friends (everyone similar in lifestyle). Now, via Instagram or HGTV, we’re comparing to millionaires, curated influencer images and fantasy lives of film and literature. It’s a race that can never be won, leading to feelings of inadequacy even among the objectively well-off. The result: a paradox where making $70k today affords far more creature comforts than $70k in today’s dollars did decades ago, yet people feel more financially insecure.
Choosing Freedom Over More “Stuff”
The encouraging flipside is that if lifestyle inflation is partly a choice, so is lifestyle deflation.
we have more control over our financial well-being than we may realize
Not everything is controllable, but many things are within our personal decision making:
- what car, if any, we drive and how often we replace it
- how big a home we really need and if you share it with others
- where we live and where we work
- how often, if ever we holiday overseas or interstate
- how often we upgrade phones, furniture and wardrobes
- how much we dine out
- what you do we leisure and fitness
By consciously opting for “less,” we can live more, more freely, with less debt and stress. This is a core philosophy of the Living More with Less project: that minimalism and mindful consumption can lead to greater happiness than the endless pursuit of more.
Consider housing: maybe it means choosing a slightly smaller home that’s cozy and sufficient, rather than maxing out the budget on the biggest house the bank will finance. A smaller home is not only cheaper; it’s easier to clean and maintain and forces you to declutter. Similarly for cars, many families are finding one car is enough with a bit of planning (especially with COVID facilitating the move to remote work, ubiquitous delivery services and increased services for active transport in many major cities). Dropping from two cars to one can be a huge boon for financial security, saving more than $10,000 per year on finance, insurance, registration and maintenance [BTS]. And if you substitute driving for active transport or carpooling, you get the benefit of excercise or social time respectively; both major well-being boosts.
Global perspectives bear this out. Our friends in Germany, for example, typically live in smaller homes and drive more modest cars than Americans, yet they enjoy high living standards and often better work-life balance. The average German home is about half the size of an average U.S. home, and Germans on average work ~1,350 hours a year (that’s 400 fewer hours than Americans!) [money.com]. They also have at least 4-6 weeks of paid vacation by law. And guess what? Germany’s middle class reports less financial anxiety about affording basics. Culturally, there’s a bit less emphasis on accumulating stuff and a bit more on leisure and security. The U.S. diverges here: with the historical “bigger is better” ethos and no federally mandated paid leave, which perhaps nudges Americans to work longer and spend more on conveniences to save time.
Australia and the UK fall somewhere in between. Our households also accumulated more gadgets and bigger homes over time, but both nations still mandate more annual leave than the U.S., and culturally there’s value placed on not being “all work, no play.” For instance, the average full-time Australian gets 4 weeks of vacation and we often actually take it. Aussie homes on the other hand have grown to over three times the floor area over the same time frame, though that trend is finally beginning to reverse.
These countries show globally aligned trends in tech adoption and income growth, but some divergence in how people choose to allocate time and money. The result is that mental health outcomes and stress levels vary: countries that encourage unplugging and taking breaks see lower reports of work-related burnout. In contrast, Japan has famously struggled with overwork, even giving the problem its own name (karoshi), though they are improving; and the U.S. has high rates of stress/depression tied to work and financial worries.
The good news is we don’t need to wait for national policies to change to start improving our own situation. We can individually adopt a “live more with less” mentality. That might mean embracing budgeting not as a painful restriction but as a path to freedom: cut out the expenditures that don’t truly bring joy or value, and suddenly you might afford to drop a day from your work week or change to a less intense job. Indeed, many people are intentionally downshifting careers after realizing that a big paycheck isn’t worth it if your mental health is suffering. When you’re not chasing the latest lifestyle upgrades, you may find that a middle-class salary goes a lot farther than you thought, and you gain the priceless commodity of time.
Where Did the Time Go?
Back in the day, time with friends and community featured more prominently. Americans averaged around 6.4 hours per week with friends in the mid-1960s. Today, that number has dropped to about 4 hours, often absorbed by screen time or fragmented schedules. Similarly, community involvement (like attending church, civic groups, or local clubs) has shrunk from 3.5 hours per week to just 1.5 [BLS]. This reduction in meaningful social interactions has profound implications for both mental and physical health as recently discussed in this blog post.
Meanwhile, passive leisure like television and screen use has more than doubled, from 12 hours per week in 1960 to over 22 hours today, when factoring in TV, streaming, phones, and social media [BLS]. That’s almost a full day each week spent staring at screens on top of the time spent doing the same for occupational purposes. Often those activities are happening while multitasking or in isolation, contributing to the 300% increase in adult obesity [NIH].
Active leisure, on the other hand, things like sports and exercise have also decreased slightly, from 6 hours to about 5.2 per week [BLS]. And while gym memberships and fitness classes were practically non-existent in 1960s the active living and team sports of that era has been largely replaced by exercise routines in air-conditioned gyms with minimal interaction with others.
Add to this a subtle rise in total work hours per household. This includes unpaid domestic work, like cleaning our larger houses, extra cars and all our toys, which rose from 104 hours per week to 112 [BLS]. There are fewer people per household to divide this work between. And for those with children, an ever growing list “extra-curricular” activities filling our weeknights and weekends. Its no wonder the modern lifestyle starts to feel not just busy, but stuffed full. Yet not always full of what matters.
we all have more discretionary time than ever, but we often spend it in ways that don’t replenish us
The proliferation of screens, fragmented family life, and a decline in communal rituals have eroded many of the ways people used to unwind or connect.
The good news? If our schedules are packed with optional consumption such as screen time and indoor exercise, we can also choose to restructure them. Replacing some of that with shared meals, walks with friends, time in nature, or community projects is not just a possibility, but a liberating one. To feel as though we have the capacity though, first we have to let go of the expectations.
Reframing Success and Security
A key takeaway from comparing 1960 and 2020 is that financial security is relative. In 2020, we have unbelievably nice things, hardly imaginable in 1960. Multiple TVs and internet-connected devices galore, kitchens full of labor-saving appliances, robot vacuums and lawnmowers. Not to mention smartphones that put a world of entertainment and info in our pockets. If you time-traveled a 1960s middle-class family into a typical 2020 home, they’d be astonished at the comfort and conveniences. By historical standards, we are extraordinarily well-off.
Yet many middle-class families now don’t feel rich, in fact, they feel one payslip away from disaster. Some of that is due to systemic issues (such as high housing costs thanks, medical bills or student debt). But much is also due to how expenses scale up with lifestyle choices. The perception of a cost-of-living crisis can partly stem from trying to maintain a level of consumption that perhaps just isn’t sustainable without stress.
The empowering insight here is that by dialing back that consumption a notch, one can create an “affordability buffer.” For example, living in a slightly less trendy neighborhood or buying a used car instead of new can free up thousands of dollars a month. That money can go toward an emergency fund, creating real financial security against shocks. Or toward experiences and hobbies that bring happiness but don’t necessarily cost much. Or to effective charities that help improve hundreds of lives.
Importantly, working harder and longer hours is not the only or best path forward to achieve one’s goals. In fact, beyond a certain income, additional work tends to yield diminishing returns in life satisfaction. The 1960s middle class took for granted things like family dinners, Sundays off, and annual vacations, even if just a modest road trip. They weren’t hustling 24/7, in part because the culture valued time off. The weekend was sacred and vacations (though shorter than Europeans’ and Australian’s) were taken. People had time for their neighbours and their community and engaged in group activities.
We need to re-embrace some of that mindset. That it’s okay to pause and enjoy life with “enough” wealth, rather than maximizing income at the expense of not just leisure, but everything else. This is a necessary step for both long term mental well-being and the continued existence of human life on earth [Nature]. The latter is something I will come back to discuss in detail a future post.
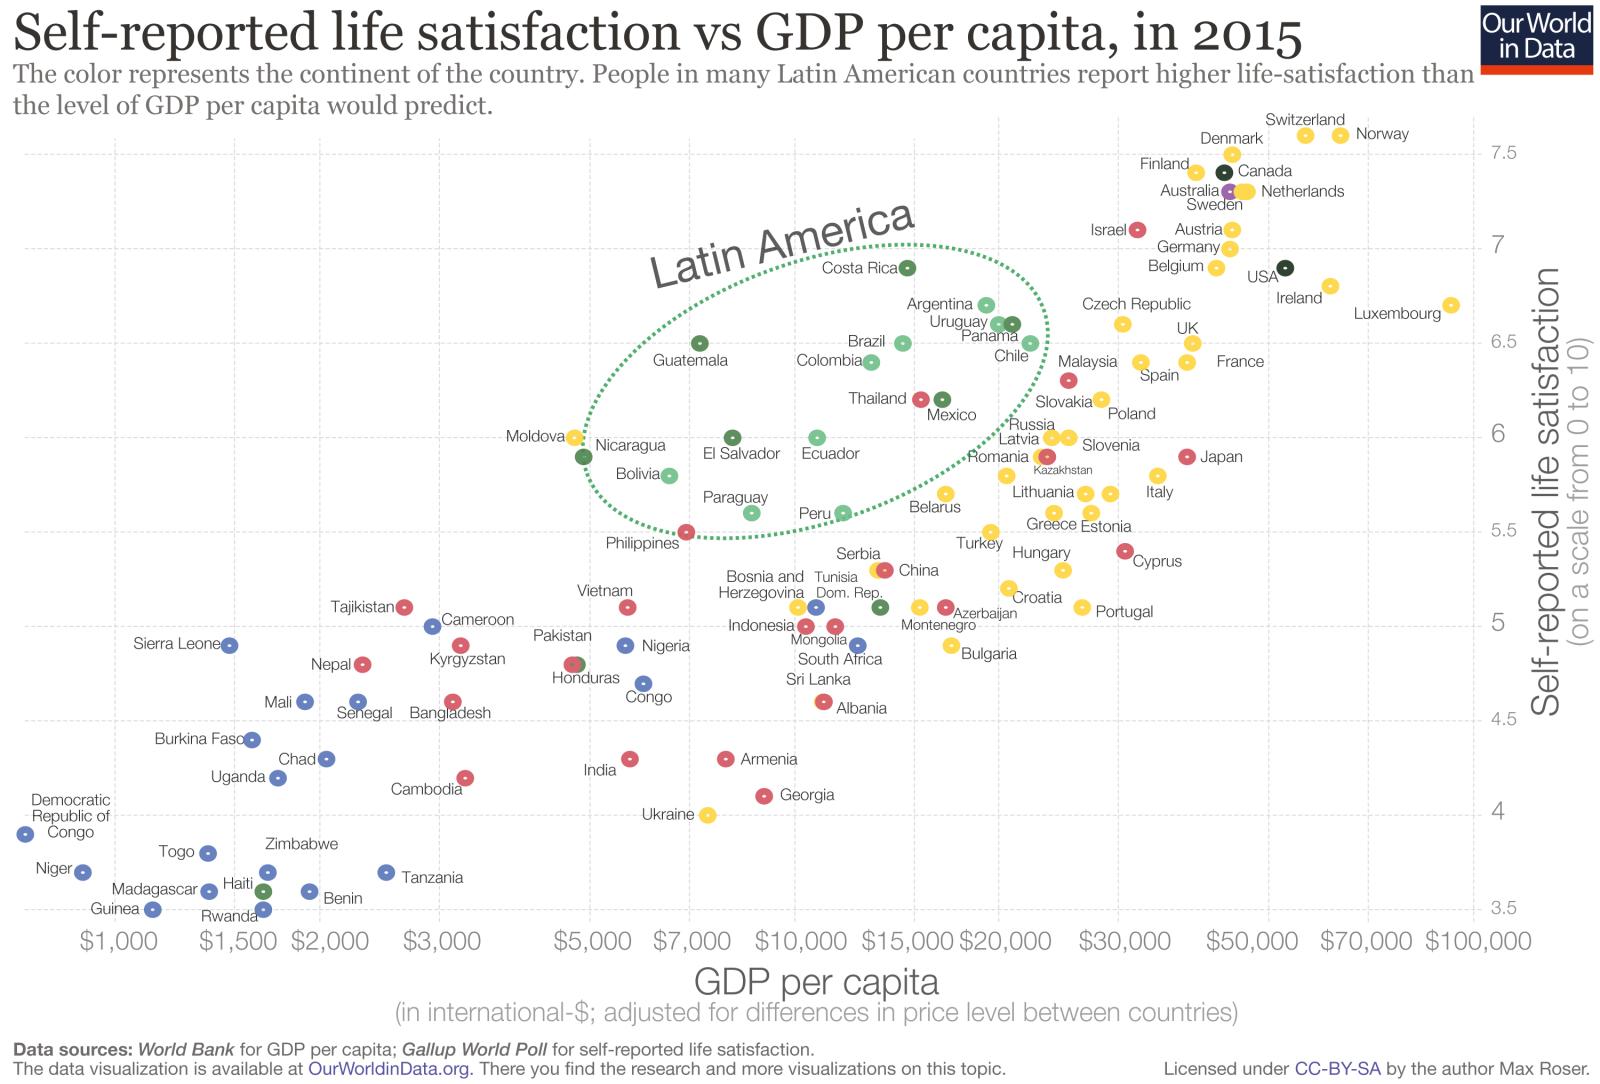
This is not mere theory; it’s supported by cross-country comparisons. Countries like Germany, France, and Sweden have lower average work hours and longer holidays, yet their middle classes enjoy comfortable lifestyles and report high happiness levels. They have chosen as societies to trade a bit of extra income for more free time. The U.S. has traditionally traded the opposite way more work for more money/consumption, but individuals can make micro-choices to buck that trend. The growing interest in minimalism, downsizing, and FIRE (Financial Independence, Retire Early) movements shows many Americans are now intentionally recalibrating what they consider “the good life.” In contrast the traditionally “relaxed” cultures of Latin America, while reporting lower happiness on an absolute basis, stand out for their happiness levels relative to income.
A More With Less Mindset
In summary, comparing the nuts-and-bolts data of 1960 vs 2020 middle-class life reveals tremendous material progress, we truly have more of everything. It also highlights how our perceptions of “enough” have shifted. The cost-of-living squeeze and the mental health challenges that have accompanied it are, in part, a byproduct of voluntary lifestyle inflation. This might be controversial, but it should also be empowering. It means we aren’t merely victims of economic forces; we have agency to change our personal trajectories.
The middle-class of the 1960s was not really any more or less contented with their lifestyle than we are now, in spite of having far fewer amenities. We don’t have to romanticize or return to 1960 though. The world has moved forward in many remarkable, positive ways. Modern life is objectively more convenient, safer, fairer, wiser and often more fun! But we can extract a lesson about moderation.
We need to take a closer look at what we dream of and why. Then make a concious choice to aim for what really matters. Maybe it feels like that renovation or promotion is really going to make a difference, but is it, actually? Meanwhile, more free time, less debt, and lower stress have big positive returns. So, the next time we feel that pang of financial anxiety or envy, pause to reflect on what truly improves our quality of life. Perhaps its time with loved ones, a creative hobby, quiet time to yourself, or a walk in the park with a friend. Or perhaps its an extended break to travel the world on a sailboat with your family, visiting the communities you have been donating your freed up money to.
Eye-opening observations!
Ironically, one problem was setting aside time to read and ponder the information– an indication of how busy and stressful our current lifestyles are!
In my case, I receive quite a few newsletters and blogs on a weekly basis and usually manage to schedule an hour or so to read them. But the weekly amount I want to digest can easily become overwhelming.
For posts and emails, I check how lengthy they are and then do a sort into ‘read now’ and ‘read later’ categories. The ‘read now’ section usually results in the lots of scrolling, while ‘read later’ means the stress of finding/making time to digest mountains of information.
I think you can guess what category your blog post fell into.
It’s a case of information overload, thanks to the internet. A problem they didn’t have decades ago.
That is indeed a little ironic and I often find myself in the same boat. How fortunate we are to have such ready access to so much information as to have inadequate time to absorb it. I have mostly tried to keep my posts under 1000 words to make them as easily digested as possible, but some things begin to lose meaning when simplified too far. I just have to make my work high enough quality that time spent reading it is worthwhile!