This article provides an analysis of the quantity of fuel imported into Australia from Middle-Eastern origins and explores the implications of the Iran war on Australia’s fuel supplies. We look at three possible scenarios, indicating the likely shortfalls of Australia’s fuel supplies. As an aside, Australia is also heavily reliant on Middle-Eastern nitrogen-based fertiliser for agriculture and food security. We have not yet analysed the possible implications of the significant reduction in supply.
Australian Vulnerability
Australia is perhaps the most vulnerable country to a liquid fuel emergency, second only to New Zealand. We are a very small player at the end of the line in a complex supply chain. This is quite evident in the following simplified chart that I compiled. It shows the imported value of crude oil that ends up in Australia as crude oil or diesel. I have focused on diesel due to its significance in agriculture and road freight as explored later.
Crude Oil Imports of Australian Suppliers 2024 (billions of USD)
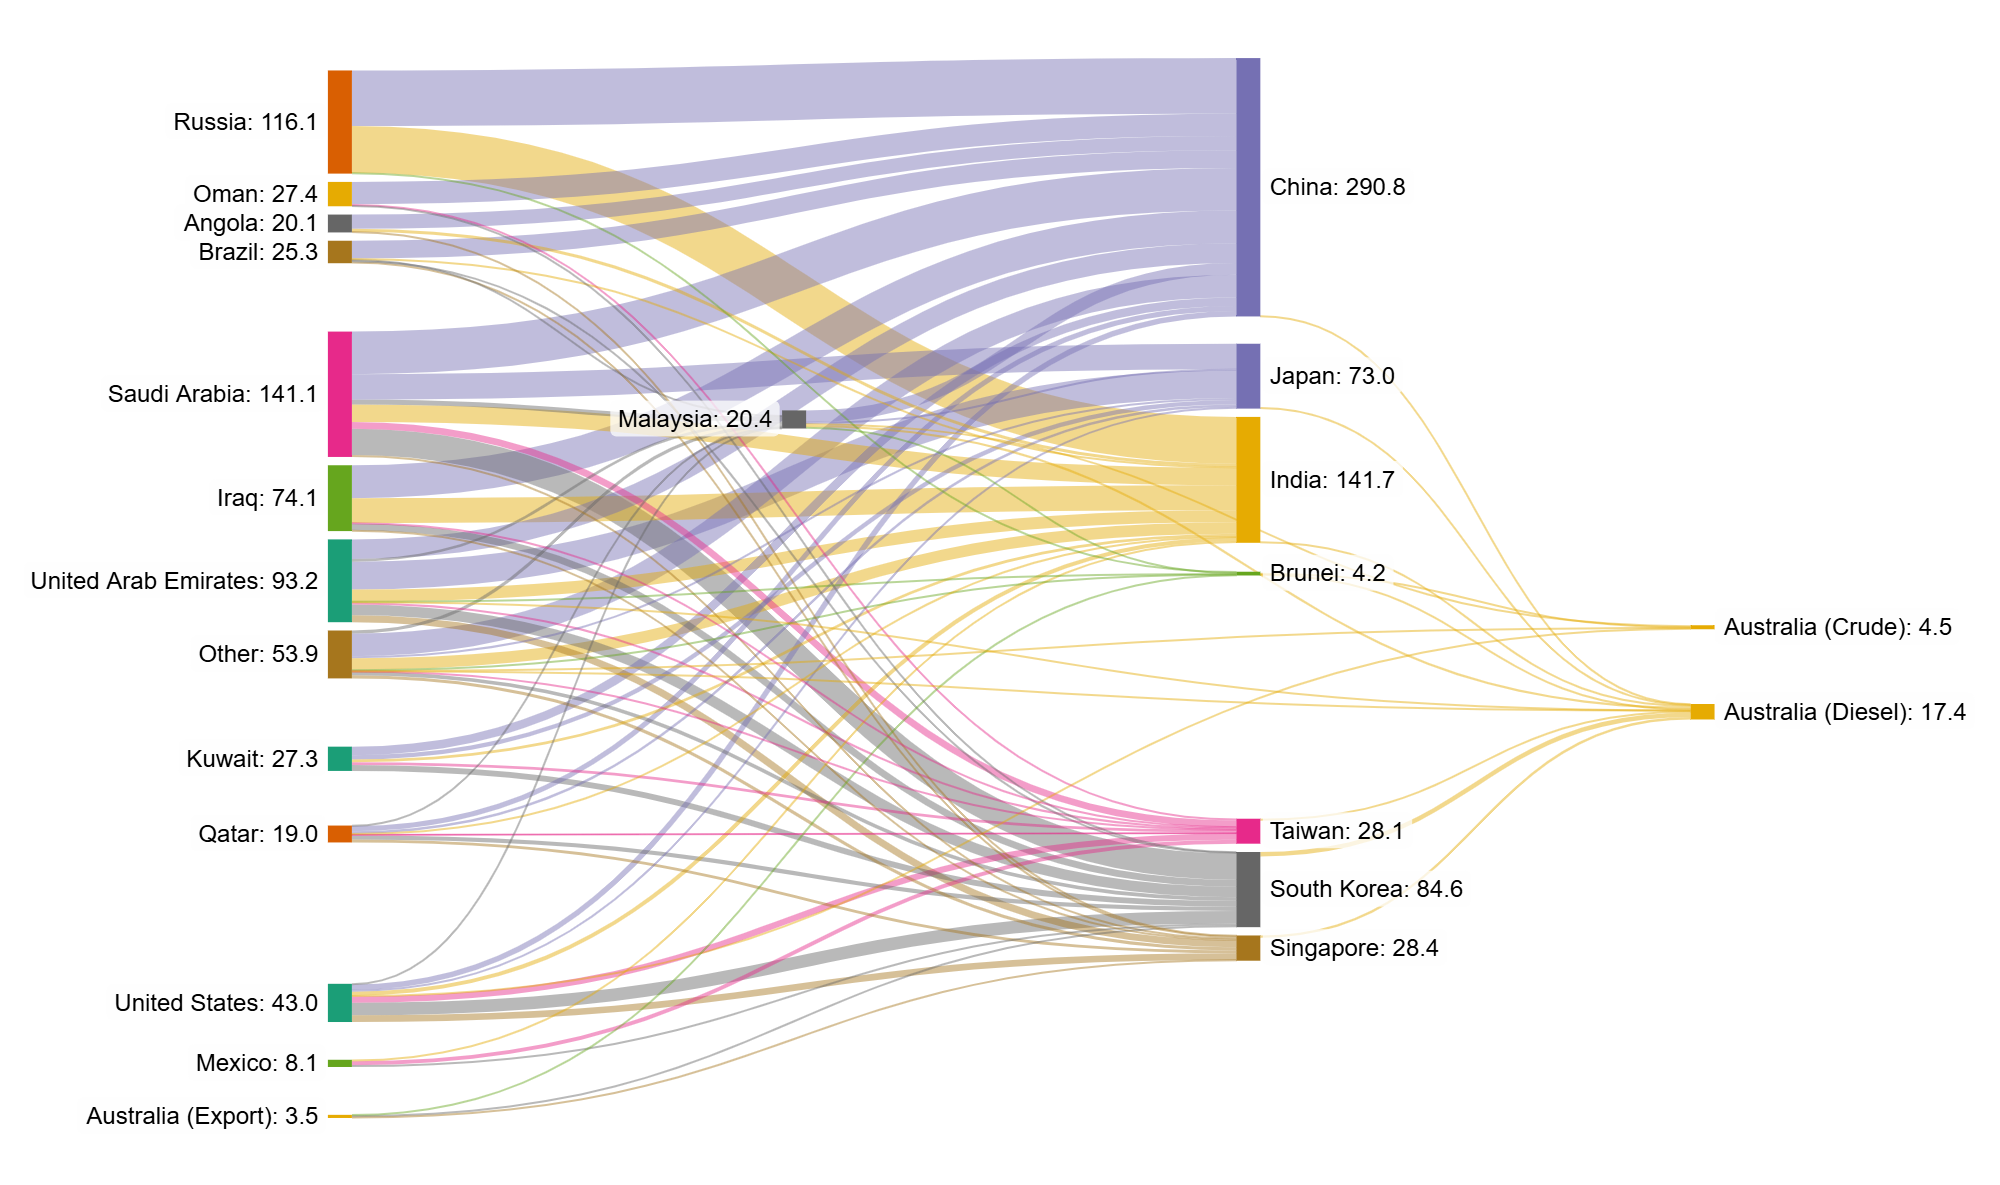
This only shows the imports relevant to Australia. To put these figures into perspective consider the global consumption of oil is approximately 105 million barrels per day (Mbpd). Australia uses about 1.1 Mbpd or 1% of the global total. Our population is about 0.3% of the world.
The following chart reveals our exposure to restrictions in output from the middle-east (shown in blue).
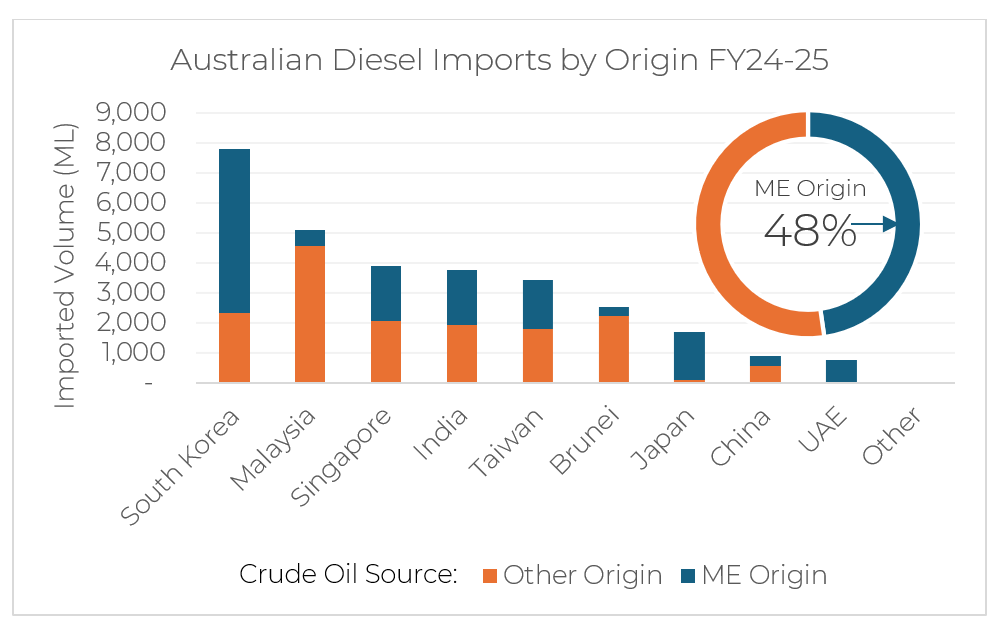
Only a small fraction of our diesel imports come directly from the Middle-East. On the other hand almost half of the crude oil for production of that diesel originates in the Middle-East. Malaysia, Brunei and China have substantial domestic production. Singapore and South Korea process most of Australia’s crude production. I have only traced the origins back one layer for Middle-Eastern vs non Middle-Eastern origins. It is likely that with some recursive effects, we would find an even greater portion of total supplies originate in the Middle-East and have simply been resold. This would amplify the implications of the Iran war on Australia’s fuel supplies.
Australia imported a total of 33,500 ML of diesel in 2025. Domestic production added an additional 4,500 ML from 17% local and 83% imported oil. More than 90% of this was used domestically. Australia extracted about 15,000 ML of crude oil and condensate for export.
Unit Conversion
There is the potential for much confusion with the use of so many different units relating to oil and energy from barrels to litres to joules to dollars to days. The majority of international reporting is in millions of barrels per day and billions of US dollars per year. Australian reporting, on the other hand is in mega litres and petajoules per year. Below are some of the conversion rates. With oil price fluctuating wildly this is the least reliable conversion and is best used for historical comparisons in the same period.
Stock
1 barrel (bbl) = 159 litres (L) = ~5,900 megajoules (MJ)
1 megalitre (ML) = 6,290 bbl
1 bbl = ~ 60 to 100 USD
1 day of consumption cover for diesel in Australia = 92 ML
Flow
1 million barrels per day (Mbpd) = 58,000 ML / year = ~2,200 PJ / year = ~70 GW
1 Mbpd = ~22 to 36 billion USD / year
The Global Situation
The present hostilities have effectively closed the strait of Homuz to marine traffic. This is clear on the map below, captured Thursday 19th of March. You can see just one tanker on the strait, circled in pink. The dots represent stationary tankers, waiting for passage.
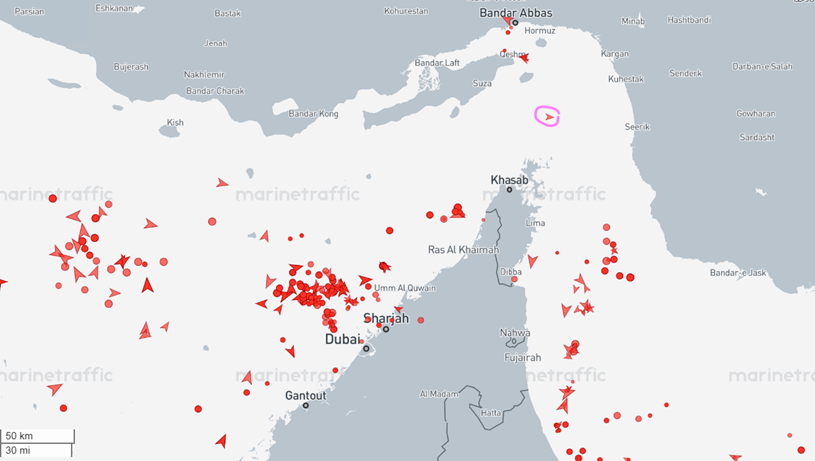
In the last several days a handful of Iranian, Chinese and Indian vessels have passed through. Compare this to the average of 159 per day in January. This leaves just overland routes to carry the oil through to other ports as below.
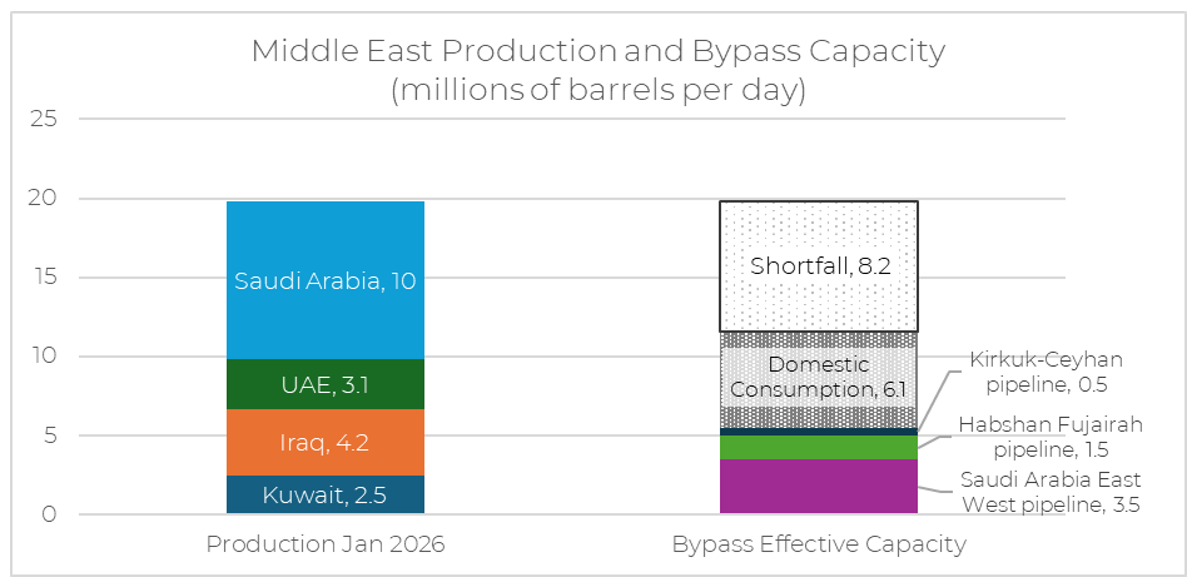
The shortfall at 8.2 million barrels per day (Mbpd) represents approximately 60% of the previously exported production of 13.7 Mbpd. This is approximately 8% of the global production of 105 Mbpd in January.
As of the 18th of March, there is some promise of non-US aligned vessels being allowed to make the passage if transactions are closed in Chinese Yuan rather than US dollars. While hopeful, this situation may be short-lived and prompt further interference from the US to avoid losing economic influence.
Scenarios
It is impossible to guess what direction the conflict will take next. We can however look at possibilities to help establish book-ends and the potential implications for us here in Australia. I have used the import and consumption data of diesel from 2024 and 2025 levelised across the year, to make rough models starting from the current reserve stock levels. Most of this data is sourced from the excellent Power BI data interface from the Australian government.
Best Case (For fuel)
Events: The war ends tomorrow. The unaffected gulf states resume export at 80% of pre-conflict rates. The US or China takes over the Iranian export facility on Kharg Island with the nuclear reactor aboard an aircraft carrier within one month. Refiners draw on emergency reserves to supply full demand for refining. Damaged infrastructure is repaired at the balance of plants within two months, restoring full production capability. All Australian production is retained in Australia and all shipments enroute to Australia arrive.
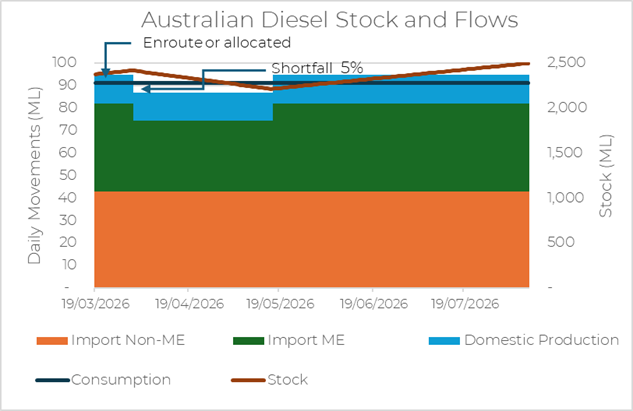
Implications on Australia’s fuel supplies: In this case reserve stocks are initially increased thanks to the retained Australian production. After enroute and allocated stocks arrive, a shortfall of 5% draws down the reserve stocks until imports resume in mid-May. Domestic production continues to be retained to increase stocks. Restrictions seem unlikely except to counter hoarding affecting farmers and remote consumers. Prices are likely to continue to rise with uncertainty until full supply is returned.
Moderate Case with Fair Distribution
Events: Conflict remains ongoing, but Middle East production continues at a bypass capacity of 43% as noted above. Refiners operate at 92% of pre-conflict levels and continue to supply Australia with the same share of total production as pre-conflict. 92% of Australian production is retained in Australia. Middle East production is restored after four months.
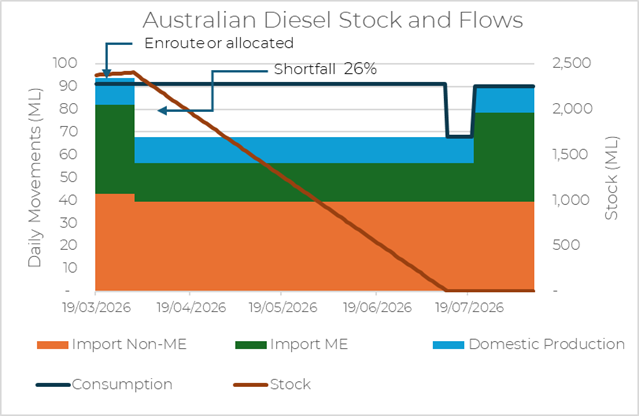
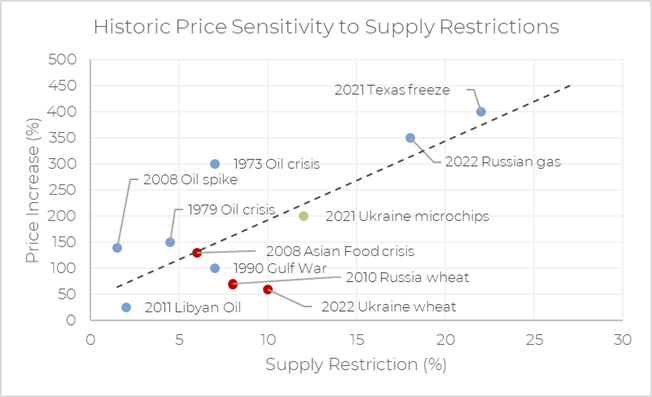
Implications on Australia’s Fuel Supplies: Once the refined products enroute and allocated to Australia have been used we face a 26% shortfall in supply. With no change in consumption the stocks will be depleted by mid-July. At that point there will be no choice, but to reduce consumption to match available production. Prices of refined products are likely to see increases in the order of 400% based on the historical precedents. Examples include the 1973 oil crisis and the 2022 natural gas restrictions following Russian invasion of Ukraine.
Prolonged Severe Shortage and Hoarding
Events: All Middle-East production and/or export facilities are incapacitated. Refineries elsewhere prioritise domestic consumption, reducing stocks available to Australia to 50% of pre-conflict levels. Half the stock enroute to Australia is redirected before arrival. Over a period of five years, refineries are recommissioned to handle greater portions of oil from other sources. Venezuelan, Russian and other production capabilities increase over the same period. Biodiesel production is substantially expanded, devastating tropical forests.
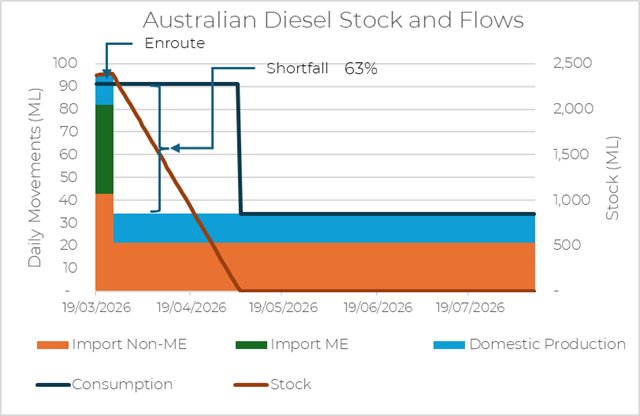
Implications on Australia’s Fuel Supplies: A shortfall of 63% without demand management will see reserves depleted by the start of May. The Government is likely to declare a Liquid Fuel Emergency which allows for significant intervention in a range of ways as set out in the Liquid Fuel Emergency Guidelines 2019.
Government response
Severe restrictions will be likely to ensure prioritisation of military, freight and essential services which are nominated in the policy document as follows:
Essential user classification is defined by the user’s need for a particular refined petroleum product to undertake an activity that:
• relates to Australia’s defence; or
• relates to the provision of the particular product as fuel for ships and aircraft engaged in international or domestic trade or commerce; or
• relates to the export of the particular product from Australia; or
• relates to activities essential for the health, safety and welfare of the community as listed in the Liquid Fuel Emergency (Activities – Essential users) Determination 2008.
The activities listed in the Determination are:
• an ambulance service;
• a corrective service;
• a fire or rescue service;
• a police service;
• a public transport service;
• a State Emergency Service or an equivalent organisation; and
• a taxi services.
In other words the following uses get priority:
- Defence
- Air and sea freight
- Emergency services
- Public transport
- Taxis
Notably absent from the list is road freight and agricultural users. That is unless they are included in the definition of commerce, which makes this a very open ended definition.
What about the 90 day IEA obligation?
Australian government and industry representatives have repeatedly assured the public that we won’t run out of fuel. Ministers have stated that we were in the process of securing supplies. Yet, the only additional supplies I can find mention of are not supplies at all, but existing reserve stock.
There are several ways of indicating available stocks of supplies, with different inclusions and exclusions. The International Energy Agency (IEA) requires net-importing member countries to hold 90 days worth of imports to help stabilise global supply. By this measure Australia has approximately 49 days as of December. This includes supplies on the water and overseas allocated to Australia, averaged across all petroleum products. Australia is one of only two IEA member countries to hold less than the obligated reserve stock. The reported reserve of diesel currently available is 26 days worth of consumption.
How is oil used in Australia?
Oil makes up by far the largest portion of Australia’s energy consumption at 58%.
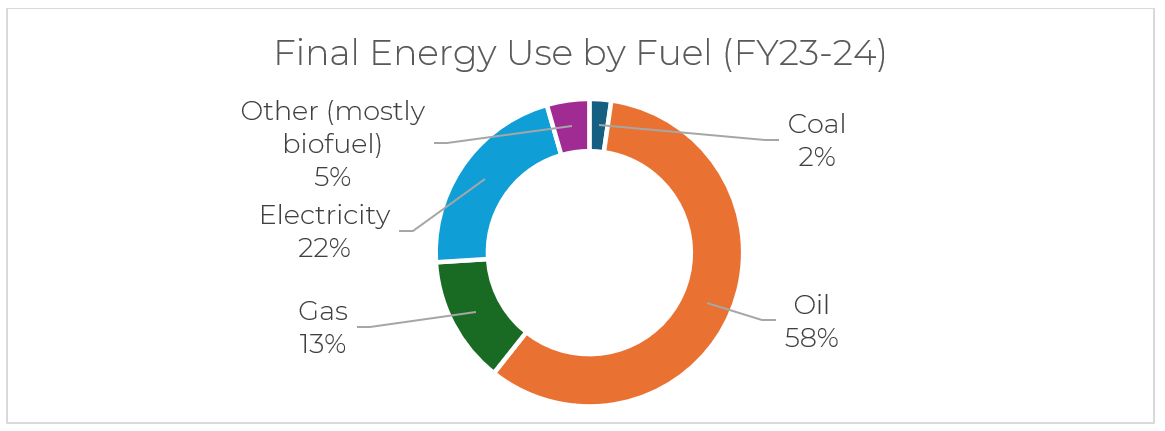
It is used primarily for transportation of goods and passengers (73%), but has other diverse applications:
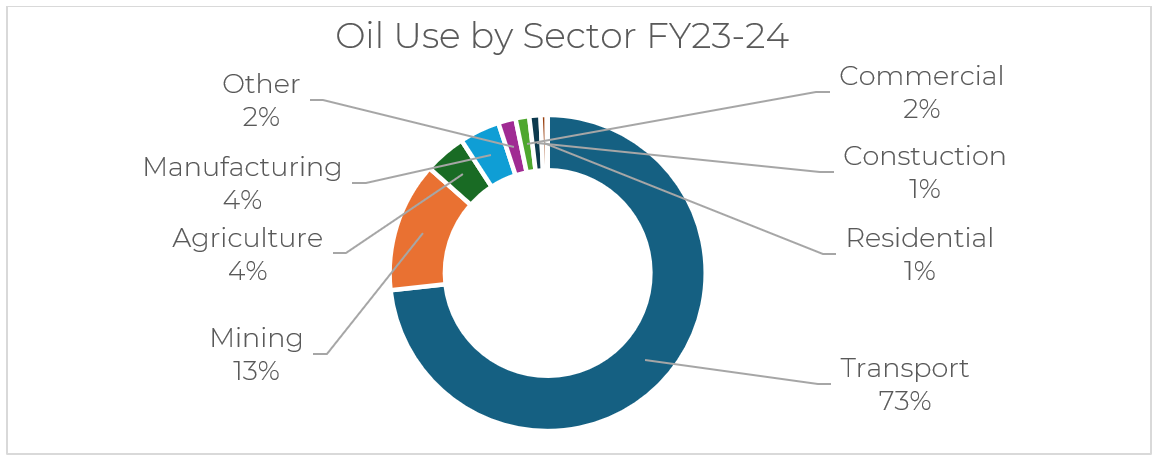
Diesel makes up the largest portion of oil products at 56%, but we also depend heavily on automotive and aviation fuels:
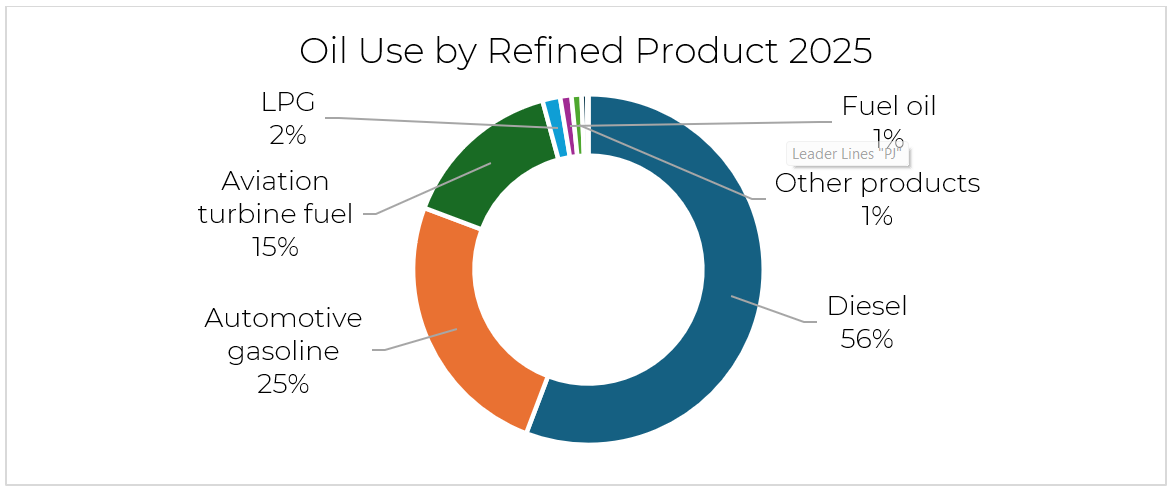
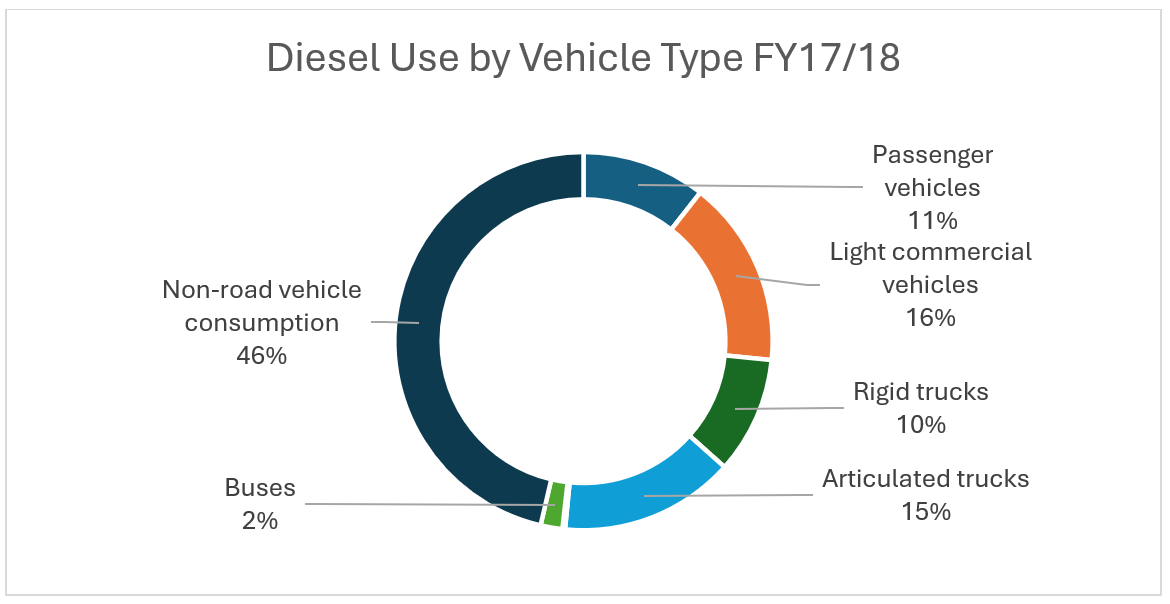
That diesel is used by a range of vehicles as well as stationary applications. Notably, a large portion is not accounted for in the data for motor vehicles. This would include marine, agricultural and mining activities including generators and machinery. Below is is the latest available data unaffected by COVID restrictions.
How are other countries responding?
There have already been pro-active measures taken in a range of countries in anticipation of supply restrictions. These include:
- Bangladesh is rationing fuel per customer and has closed public schools
- Pakistan and Sri Lanka have instituted four day weeks for government employees
- Myanmar is permitting private vehicle use on alternate days based on licence plate number
- Thailand and Vietnam are pushing businesses to encourage employees to work from home. They have also and instructed government employees to limit air travel
Sources: BBC New, Live-mint (Ads)
What can we do about it?
It is worth considering both short-term financial implications and probable direct restrictions on travel. Our household is planned around car-free living, yet we continued to use a car regularly up until last year. It wasn’t until we really tried to do without a car that we discovered how possible it is, after making a few adjustments.
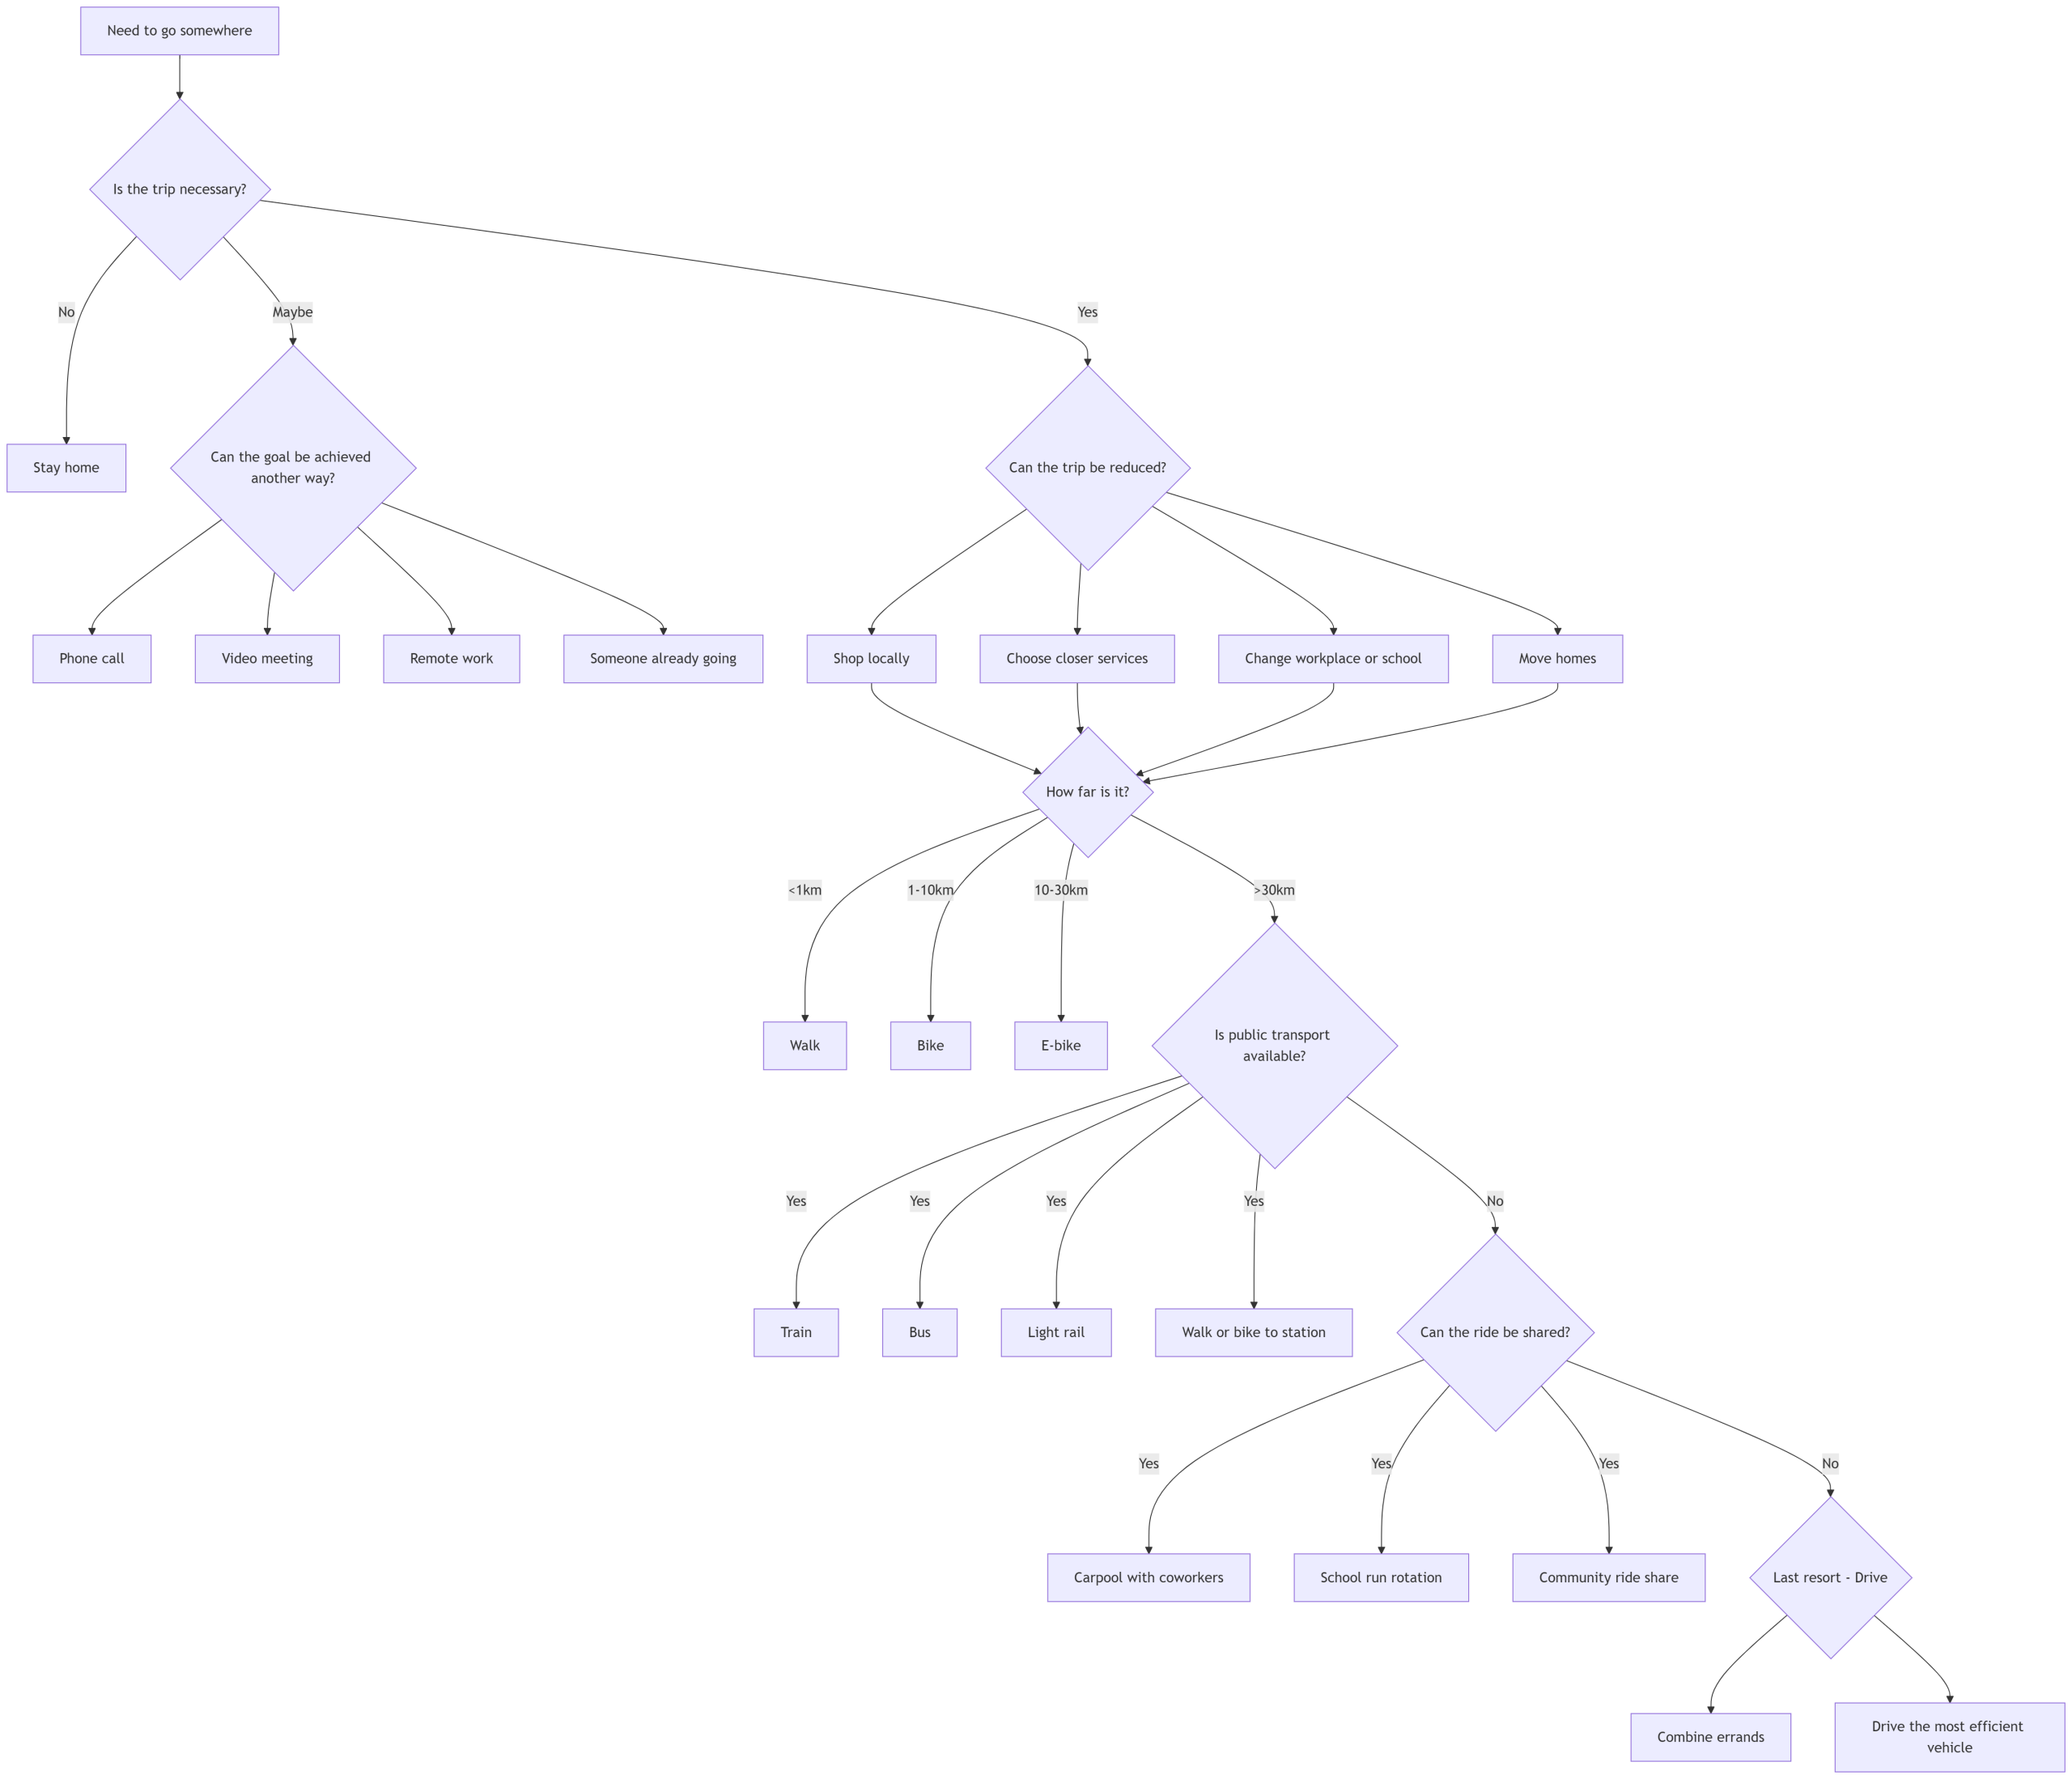
Trip Planning
Here is a flow chart that can be used to work towards reduced car dependence. Yes, some items are dramatic. It’s all about priorities. There are also many co-benefits to slower travel which help us on our endeavour to Live More with Less. I’ll relate some of these in a separate post.
Considerations
- Do you have a bike for everyone in your household?
- Are they in working order or do you know someone who can fix it for you?
- Do you know how to safely get to your key activities without a motorvehicle?
- Do you know which public transport options are available to you?
- What services are available closer to home?
- How well do you know your neighbours?
- Are you set up to work and/or school from home?
Obviously this is too accurate as they’re moderating it on all Reddit posts. Which in itself is more concerning.
I have three articles on this from a New Zealand perspective, I’m happy to share if that would be of interest.